Forex trading is a business that can generate high profits, but it has also a high risk of possible loss of funds

We have been trading forex since 2009.
At middle of 2011 decided to be full trader, there are many Forex Trading Strategy that we have learned and test to have the optimal results, until we got one that could give best results over all.
Since June 2012 we have opened PAMM Account with HotForex
PAMM services is the easy way to provide opportunities for investors who want additional incomes , without additional works.
As Funds Manager, we take 25% success fee.
TRADING METHODOLOGY
Glimpse of our trading methodology that we have been using for trading forex market...
We are manual trader and full technical trader but we do not use technical indicators to open a trading positions, this may sound strange for forex technical traders So... what we used? we using mathematical calculations for entry to the market.
We have assume that the forex market has a behavior, and behavior itself can be seen from the history.
Therefore, we tried to create a mathematical formula to compare current behavior with past behavior.
And for the required data are yesterday's OHLC and today's Open price. How it work? After enter the required data to our mathematical formula, we will get some key values for today's market conditions, then we will looking for the past conditions in our database by filtering method to find out the day which has same or near key values, usually there were more than 3 days that has near conditions. What is next? we will compare current movement with our predictions movement by using H1 and H4 candle, after get nearest behavior we will enter the trade. After that? we will monitoring within specified time period for make sure that market movements stay in way. How if market in wrong way? of course we will close running profit or hedge our trade and we will see the second choice prediction.
Market only will go to north (down) and south (up), market will not go to east or west, isn't it?
Look at table below, this is sample of our calculations to make analysis of daily trend on EURUSD pair :
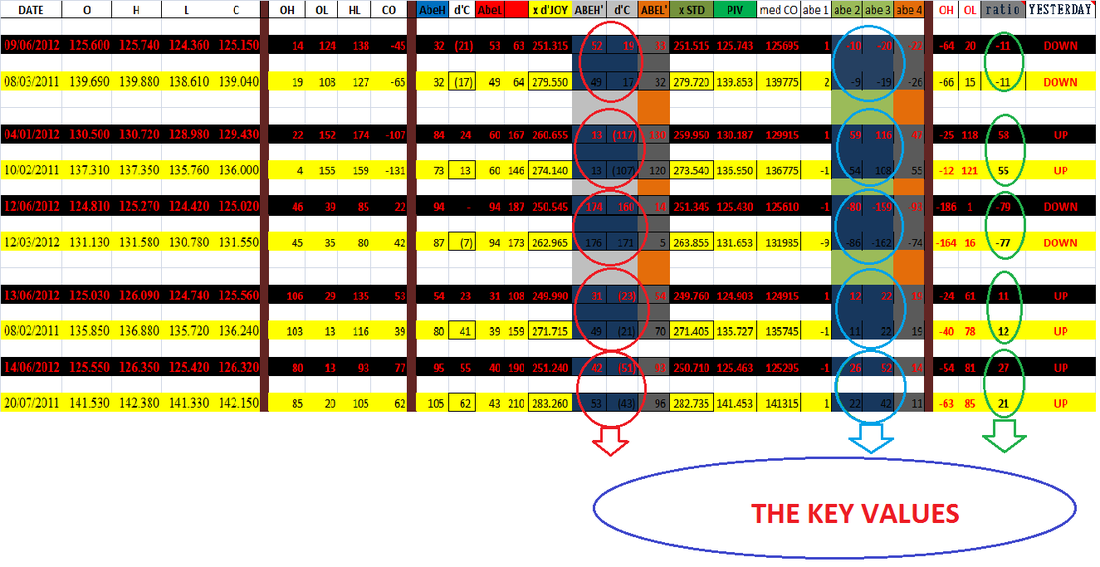
EXAMPLE :
We have predicted that EURUSD on 09 June 2012 will have same behavior with 08 March 2011 because it has same or near key values, so we have decided to open short EURUSD on 09 June 2012. We have described above that we used H1 and H4 candle for entry to market and on that moment we put also target profit at open price minus 120 pips, our target were not reached, no matter... at least we have saved over than 60 pips at closed price daily candle on 09 June 2012.
As we know that there are alot of forex trading strategy, and nothing is perfect.
But the most important = final result ( percentage return of investment ) which steady within specified time period.
GOAL
We do not have specified monthly gains target, we just follow the market conditions. Why? because we just do a trend analysis of daily. today is today, it is not tomorrow or the day after tomorrow. Next day will be treated with different analysis and so on until period of weeks, months and years.
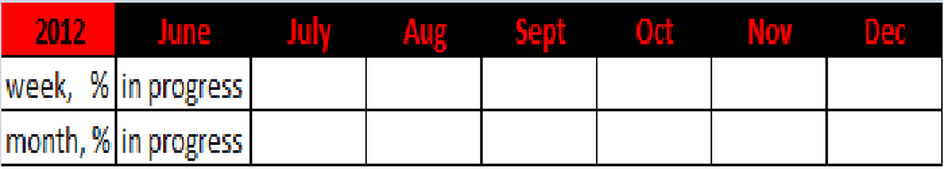
Oke, Let we show you here, How Our Strategy make average weekly and monthly Absolute Gains.
Oke, Let we show you here, How Our Strategy make average weekly and monthly Absolute Gains.